A FINANCE-READING PREDICTION ENGINE · YOUR DATA · YOUR OUTCOME
READ THE MARKETS. ADD YOUR DATA. PREDICT. MANAGE RISK.
금융을 읽는 엔진에, 기업의 데이터를 더합니다.A finance-reading engine, plus the data only you have.
KRATO는 금융·경제·뉴스·SNS·산업을 읽는 엔진에 기업 고유 데이터를 결합해, 시간별·다이버전스·프랙탈로 분석하고 연산해 기업이 필요로 하는 결과를 예측하고 리스크를 관리합니다. 금융을 읽기 때문에 산업 전반의 예측에 강하고, 금융·경제를 이해하기 때문에 투자하는 사람에게도 힘이 됩니다.It combines an engine that reads market, macro, news, social and industry data with your own data, analyses it by time, divergence and fractal structure, and predicts the outcome you need while managing the risk. Because it reads finance it is strong across industries, and because it understands the economy it also serves investors.
KRATO / OPX 엔진 · LPM 핵심 기술OPX engine · LPM core technology
5+1공개 채널 + 기업 고유 데이터public channels + your own data3복합 연산 · 시계열·다이버전스·프랙탈composite · time series, divergence, fractal60m리스크 기준 구간risk baseline6해상도 · 1·5·15·30·45·60분봉resolutions · 1 to 60-minute bars
ASSEMBLY GUIDE · KRATO ARCHITECTUREOPX · LPM
1DATAC1 경제 · C2 시장 · C3 뉴스 · C4 SNS · C5 산업 + C6 기업 고유 데이터C1 economy · C2 market · C3 news · C4 social · C5 industry + C6 your data
2INGEST채널별 수집·정규화, 지연과 누락 감시Per-channel ingest and normalisation, lag and gap watch
3LPM다차원·다공간 시계열(T) · 채널별 다이버전스(D) · 프랙탈 비교(F) 복합 연산Composite of multi-space time series (T), per-channel divergence (D), fractal comparison (F)
4OPX신호를 노드·관계로 연결, 4초마다 재연산Signals as nodes and links, recomputed every 4s
근거는 KRATO가, 결정은 사람이 합니다KRATO brings the evidence; people decideKRATO / OTIFY
US 08:30 ET · KR 08:00 KST · 데모 데이터demo data
ONE FINANCIAL NETWORK. YOUR DATA ON TOP.
ECONOMYMARKETNEWSSOCIALINDUSTRYYOUR DB
01 / THE PLATFORM
관계에서 리포트까지. 하나의 예측·리스크 흐름.From relationships to reports. One prediction and risk flow.
실제 제품 화면으로 KRATO의 흐름을 살펴보세요. 각 화면을 선택하면 상세 내용을 확인할 수 있습니다.Walk through KRATO on real product screens. Select a screen to read the details.
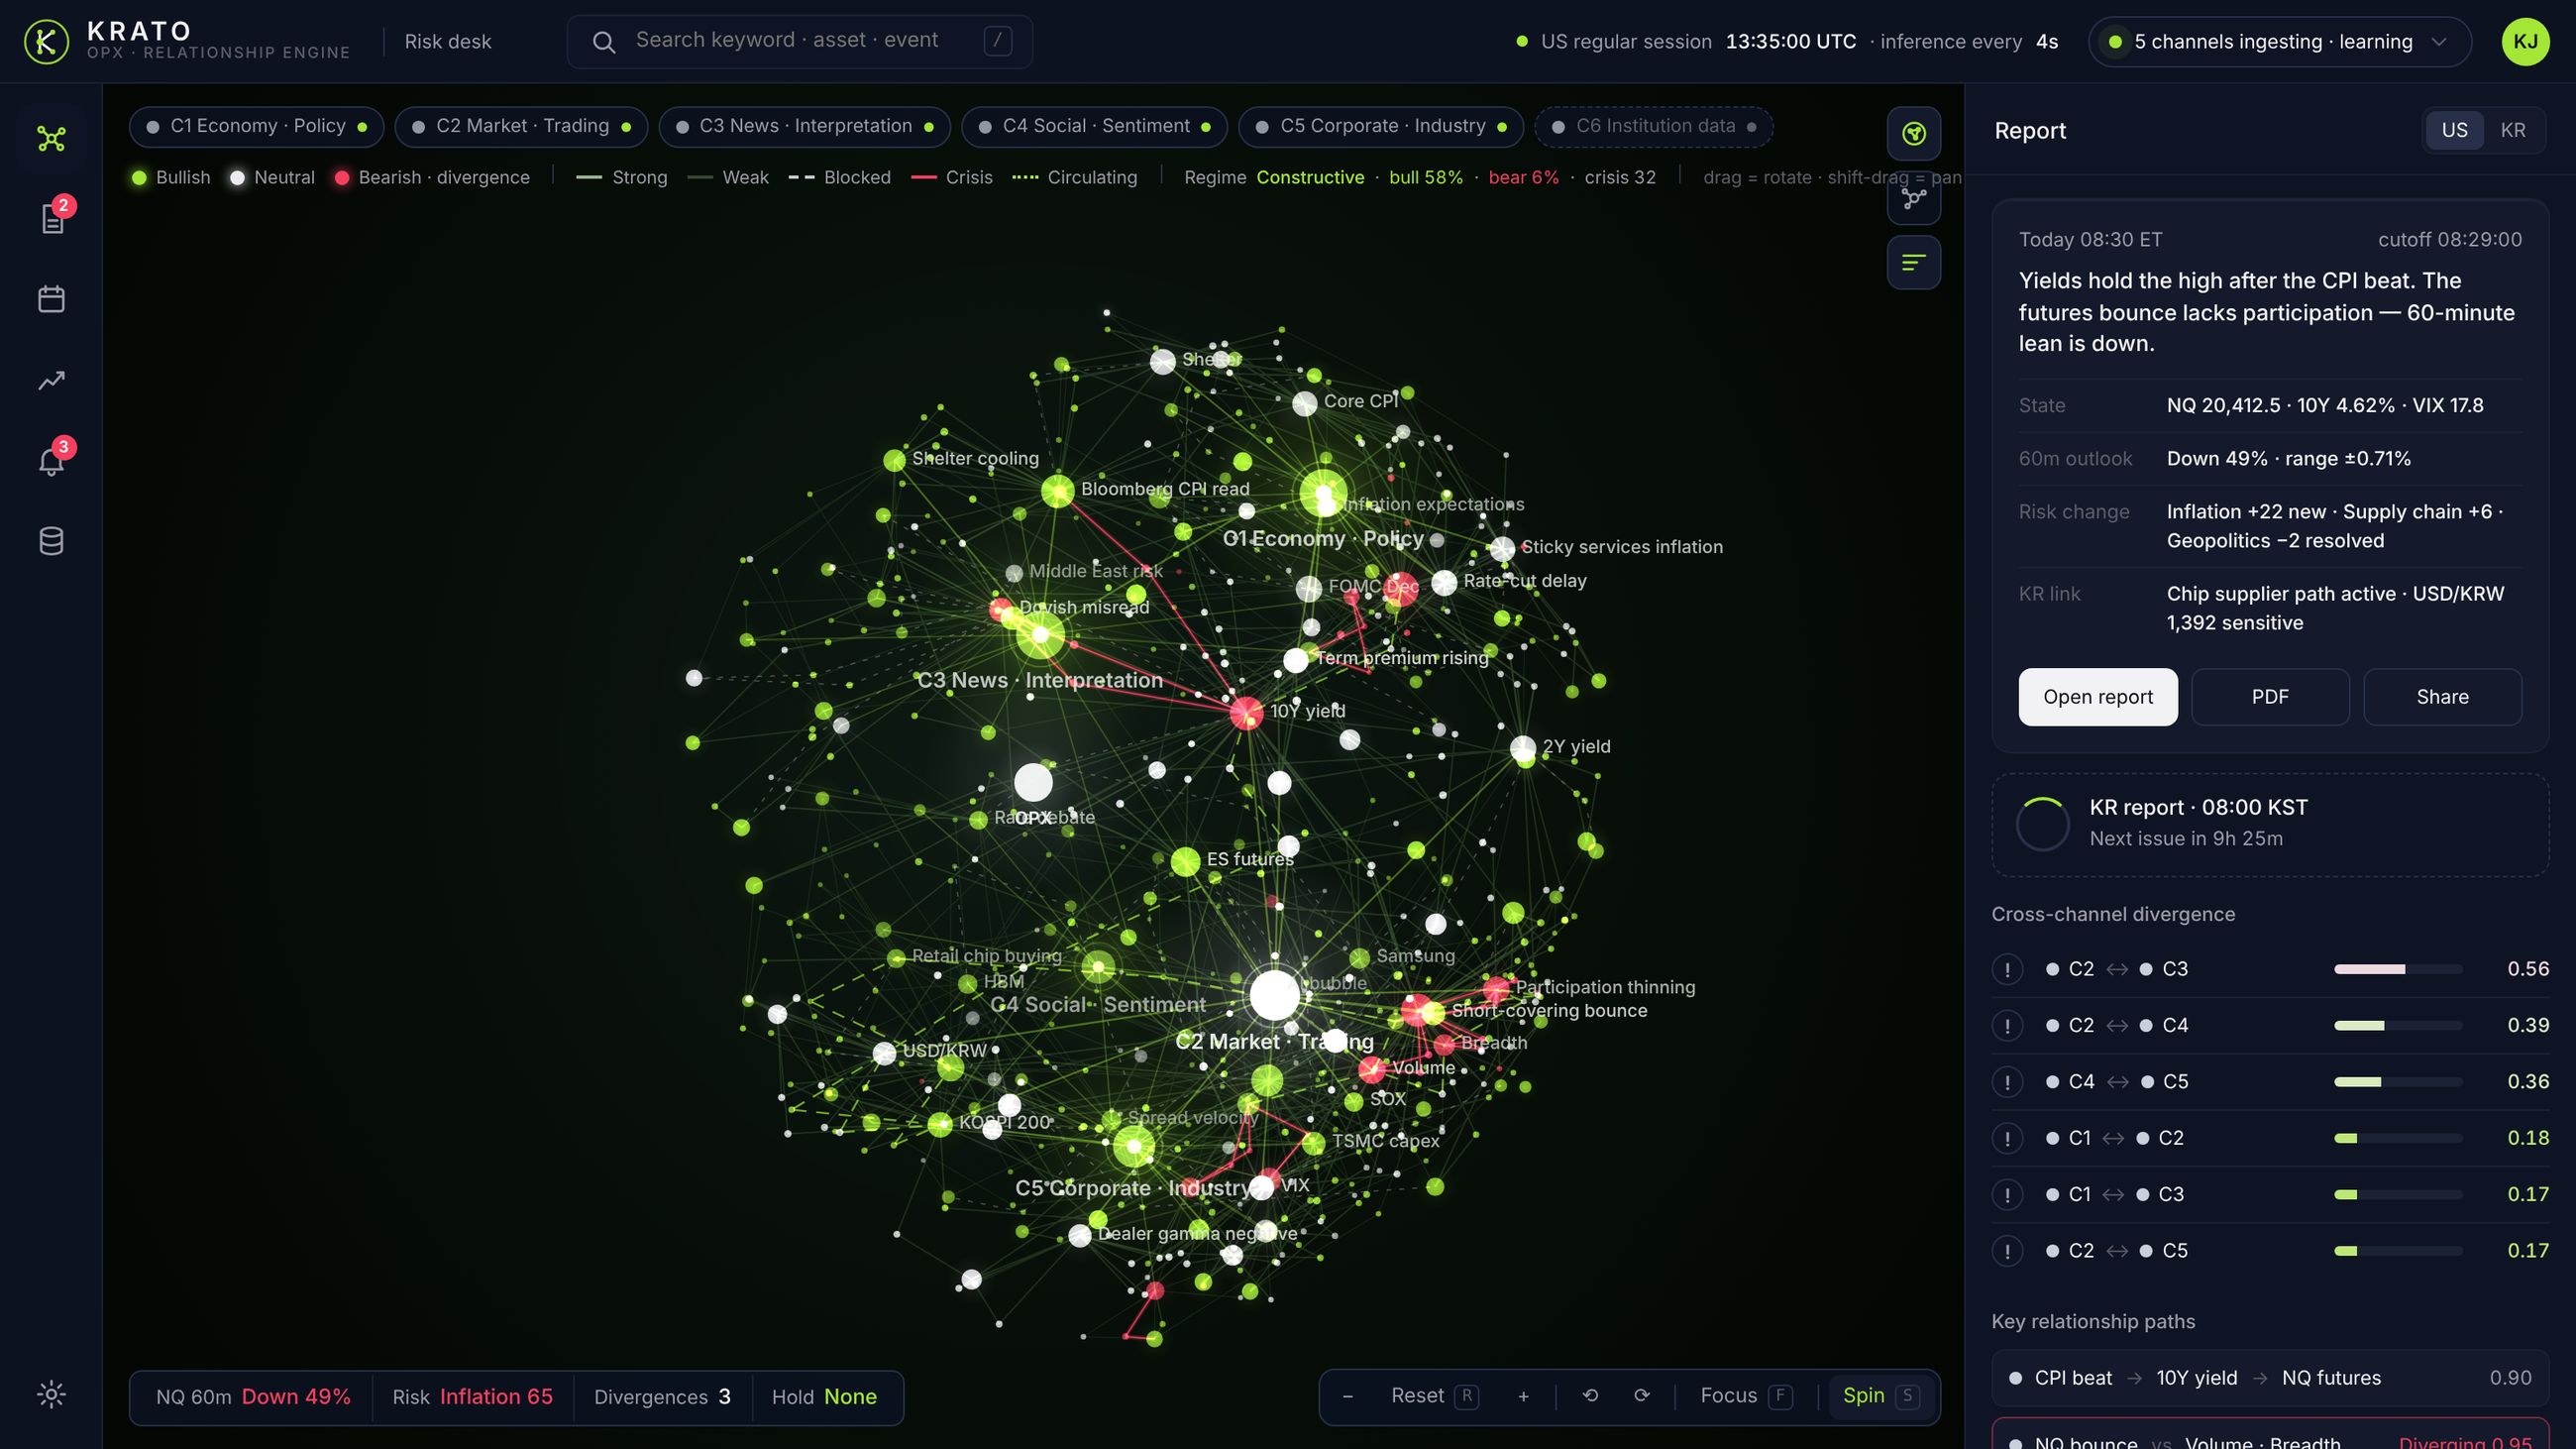
KRATO / Topology
실제 제품 UI입니다. 화면의 수치·종목·문장은 데모 시나리오(2026-11-05, CPI 서프라이즈 이후의 시장 리스크 점검)의 예시이며 실제 고객 실적이나 검증된 예측 성능을 의미하지 않습니다.Real product UI. Figures, tickers and sentences on screen belong to the demo scenario (5 Nov 2026, a bounce without participation after a CPI surprise) and do not represent client results or validated forecasting performance.
02 / WHY KRATO
금융을 읽는 눈으로, 당신의 사업을 예측합니다.Read finance, predict your business.
금리, 환율, 원자재, 뉴스 해석, 심리. 금융이 먼저 움직이고, 산업이 뒤따릅니다.Rates, FX, commodities, news, sentiment. Finance moves first; industries follow.
금융 시장은 경제 전반의 변화를 가장 먼저, 가장 촘촘하게 반영합니다. KRATO는 이 금융 신호를 하나의 관계망으로 읽는 엔진 위에 기업 고유 데이터(판매·원가·재고·포지션 등)를 더해, 기업이 정한 결과물을 예측하고 신호가 어긋나는 지점(다이버전스)을 움직임 전에 드러냅니다. 투자 기관은 포트폴리오 리스크 점검과 판단 근거로, 일반 기업은 산업 예측과 리스크 관리로 씁니다.Financial markets reflect change across the economy first and most finely. KRATO reads those signals as one relationship network, adds your own data (sales, cost, inventory, positions) on top, predicts the outcome you define and surfaces where signals disagree (divergence) before the move. Investment institutions use it for portfolio risk review and evidence behind decisions; companies use it for industry forecasting and risk management.
CURRENT APPROACH
지표 따로, 사내 데이터 따로Indicators apart, in-house data apart
시장 지표와 사내 데이터를 각각 분석 움직인 뒤에 원인을 설명 리스크는 사후 보고서로 확인Market indicators and in-house data analysed separately Causes explained after the move Risk found in the report afterwards
WITH KRATO
금융 관계망 위에 기업 데이터를 결합Your data on top of one financial network
금융 신호와 기업 데이터를 한 번에 연산 어긋남(리스크)을 움직임 전에 알림 기업이 정한 결과물을 예측하고 결과로 검증Financial signals and your data computed together Disagreement (risk) flagged before the move The outcome you define, predicted and verified
KRATO ASSEMBLY MANUAL금융이 먼저 움직이고, 산업이 뒤따릅니다.Finance moves first. Industries follow.SHEET 01 / 03
ORDER · 고객의 요구CUSTOMER NEED금리·환율이 움직일 때, 우리 매출과 원가에 언제 · 얼마나 영향이 오는지 미리 알고 싶다.When rates and FX move, we want to know when — and how much — it reaches our sales and cost.
→
DELIVERABLE · 결과물RESULT우리 지표 기준의 예측값 · 범위 · 영향 시점A forecast, range and timing — in our own metrics
환율·금리·원자재·수요처럼 금융이 먼저 반영하는 변화를 기업의 원가·판매·재고 데이터와 연결해, 사업에 필요한 결과를 예측합니다.Changes finance reflects first — FX, rates, commodities, demand — linked to your cost, sales and inventory data to predict what the business needs.
시장 상태와 익스포저를 같은 관계망에서 점검하고, 신호가 어긋나는 순간을 기준선과 함께 알립니다. 결정은 사람이 합니다.Market state and exposure reviewed on one network, with divergence flagged against your thresholds. People make the call.
RegimeDivergence 0.35알림 · 리포트Alerts · reports
FOR / INVESTORS
금융·경제를 이해하는 엔진An engine that understands the economy
금융을 읽도록 만들어진 엔진이기에 시장 상태, 신호 사이의 관계, 다이버전스를 근거와 함께 제시합니다. 자산운용·증권·연기금은 포트폴리오 리스크 점검과 판단 근거로 씁니다.Built to read finance, it presents market state, the relationships between signals and divergence with evidence. Asset managers, brokers and pension funds use it for portfolio risk review and decision evidence.
금융이 먼저 움직이는 산업이라면, 어디든 적용됩니다.Wherever finance moves first, KRATO applies.
산업마다 먼저 읽어야 할 금융 신호가 다르고, 예측해야 할 결과물도 다릅니다. 각 카드의 차트는 대시보드와 같은 소스이며, 기업 데이터(C6)는 PoC에서 연결합니다.Each industry has different financial signals to read first and different outcomes to predict. Charts come from the same source as the dashboard; your data (C6) is connected in the PoC.
KRATO / ASSEMBLY MANUAL · INDUSTRY SERIES
REV 1.0
MAIN · FINANCE · INVESTMENT
금융 · 투자Finance · investment
KRATO의 바탕입니다. 투자기관은 이 층을 직접 쓰고, 아래 6개 분야 도면의 A층은 모두 이 금융 신호입니다.The foundation of KRATO. Investors use this layer directly, and layer A in every drawing below is this financial signal.
LAYER STACK
C
투자 데스크 레이어INVESTMENT DESK LAYEROUT · 레짐 · 방향 · 범위OUT · regime · direction · range
B
C6 데이터 모듈C6 DATA MODULE포트폴리오 · 익스포저Portfolio · exposure
A
OPX 엔진 · 신호 버스OPX ENGINE · SIGNAL BUSVIX · 10Y · 크레딧 · 환율VIX · 10Y · credit · FX
ASSEMBLY STEPS
01
영향을 분석한다Analyze the impact
금리·변동성 변화가 포트폴리오 익스포저에 닿는 경로와 크기를 분석한다.Analyze how rate and volatility moves reach portfolio exposure, and how far.
02
숨겨진 신호를 읽는다Read the hidden signals
VIX·10Y와 자산군 사이 다이버전스에서 레짐 전환의 선행 신호를 읽는다.Read the leading signal of a regime shift in divergence between VIX, 10Y and asset classes.
03
정확한 예측을 돕는다Help forecast accurately
60분 방향과 범위, 리스크 지수, 철회 조건을 출력한다.Output 60-minute direction and range, a risk index and the withdrawal condition.
C6 데이터 모듈C6 DATA MODULE자금 · 부채 · 외화 포지션Cash · debt · FX position
A
OPX 엔진 · 신호 버스OPX ENGINE · SIGNAL BUSUSD/KRW · KR 3Y · 기준금리USD/KRW · KR 3Y · BOK rate
ASSEMBLY STEPS
01
영향을 분석한다Analyze the impact
환율·금리 변화가 조달 비용과 외화 포지션에 닿는 경로를 분석한다.Analyze how FX and rate moves reach funding cost and FX positions.
02
숨겨진 신호를 읽는다Read the hidden signals
자금·부채 데이터와의 시차에서 유동성 압박과 헤지 시점의 신호를 읽는다.Read the signal of liquidity pressure and hedge timing in the lag against cash and debt data.
03
정확한 예측을 돕는다Help forecast accurately
조달 비용 범위 · 환 헤지 시점 · 환산손익 범위를 출력한다.Output funding-cost range, hedge timing and FX translation range.
INDUSTRY 02 / 06 · MANUFACTURING · EXPORT
제조 · 수출Manufacturing · export
LAYER STACK
C
생산 라인 레이어PRODUCTION LINE LAYEROUT · 원가 범위 · 환 리스크 시점OUT · cost range · FX timing
B
C6 데이터 모듈C6 DATA MODULE원가 · 재고 · 판매Cost · inventory · sales
A
OPX 엔진 · 신호 버스OPX ENGINE · SIGNAL BUSUSD/KRW · WTI · 원자재USD/KRW · WTI · commodities
ASSEMBLY STEPS
01
영향을 분석한다Analyze the impact
환율·유가·원자재 변화가 원가와 판매에 닿는 경로를 분석한다.Analyze how FX, oil and commodity moves reach cost and sales.
02
숨겨진 신호를 읽는다Read the hidden signals
원가·재고 데이터와의 시차에서 환 리스크가 커지는 신호를 읽는다.Read the signal that FX risk is building in the lag against cost and inventory data.
03
정확한 예측을 돕는다Help forecast accurately
원가 범위 · 환 리스크 시점 · 구매 시점 민감도를 출력한다.Output cost range, FX-risk timing and purchase-timing sensitivity.
INDUSTRY 03 / 06 · ENERGY · UTILITIES
에너지 · 유틸리티Energy · utilities
LAYER STACK
C
발전 설비 레이어POWER PLANT LAYEROUT · 조달 비용 · 투자 시점OUT · procurement cost · timing
B
C6 데이터 모듈C6 DATA MODULE조달 · 운영 · 수요Procurement · operations · demand
A
OPX 엔진 · 신호 버스OPX ENGINE · SIGNAL BUSWTI · Fed funds · 기대인플레WTI · Fed funds · inflation exp.
ASSEMBLY STEPS
01
영향을 분석한다Analyze the impact
유가·금리 변화가 조달·운영 비용에 닿는 경로를 분석한다.Analyze how oil and rate moves reach procurement and operating cost.
02
숨겨진 신호를 읽는다Read the hidden signals
물가 기대와 수요 데이터의 다이버전스에서 비용 상승 신호를 읽는다.Read the cost-pressure signal in divergence between inflation expectations and demand data.
03
정확한 예측을 돕는다Help forecast accurately
조달 비용 범위 · 투자 시점 리스크 · 수요 변화를 출력한다.Output procurement-cost range, investment-timing risk and demand shifts.
INDUSTRY 04 / 06 · RETAIL · LOGISTICS
유통 · 물류 · 소비재Retail · logistics · consumer
LAYER STACK
C
물류 센터 레이어DISTRIBUTION CENTER LAYEROUT · 수요 범위 · 재고 리스크OUT · demand range · inventory risk
B
C6 데이터 모듈C6 DATA MODULE판매 · 가격 · 재고Sales · pricing · inventory
A
OPX 엔진 · 신호 버스OPX ENGINE · SIGNAL BUSCore CPI · 소비심리 · 환율Core CPI · sentiment · FX
ASSEMBLY STEPS
01
영향을 분석한다Analyze the impact
물가·소비심리·환율 변화가 판매와 가격에 닿는 경로를 분석한다.Analyze how inflation, sentiment and FX moves reach sales and pricing.
02
숨겨진 신호를 읽는다Read the hidden signals
판매·재고 흐름과의 시차에서 수요 둔화의 선행 신호를 읽는다.Read the leading signal of slowing demand in the lag against sales and inventory flow.
03
정확한 예측을 돕는다Help forecast accurately
수요 범위 · 가격 전가 여력 · 재고 리스크를 출력한다.Output demand range, pricing power and inventory risk.
INDUSTRY 05 / 06 · SEMICONDUCTOR · IT
반도체 · ITSemiconductors · IT
LAYER STACK
C
웨이퍼 팹 레이어WAFER FAB LAYEROUT · 사이클 국면 · 재고 일수OUT · cycle phase · inventory days
B
C6 데이터 모듈C6 DATA MODULE주문 · 재고 · 캐파Orders · inventory · capacity
A
OPX 엔진 · 신호 버스OPX ENGINE · SIGNAL BUSSOX · 메모리 가격 · 관세SOX · memory prices · tariffs
ASSEMBLY STEPS
01
영향을 분석한다Analyze the impact
반도체 지수·메모리 가격 변화가 주문과 재고에 닿는 경로를 분석한다.Analyze how chip-index and memory-price moves reach orders and inventory.
02
숨겨진 신호를 읽는다Read the hidden signals
주문·캐파 데이터와의 다이버전스에서 사이클 전환 신호를 읽는다.Read the cycle-turn signal in divergence against order and capacity data.
03
정확한 예측을 돕는다Help forecast accurately
사이클 국면 · 재고 일수 리스크 · 캐파 결정 시점을 출력한다.Output cycle phase, inventory-days risk and capacity timing.
INDUSTRY 06 / 06 · CONSTRUCTION · INFRA
건설 · 부동산 · 인프라Construction · real estate · infrastructure
LAYER STACK
C
현장 · 골조 레이어SITE · FRAME LAYEROUT · 조달 비용 · 사업 리스크OUT · funding cost · project risk
B
C6 데이터 모듈C6 DATA MODULE수주 · 공정 · PFOrders · schedule · PF
A
OPX 엔진 · 신호 버스OPX ENGINE · SIGNAL BUSKR 3Y · 기준금리 · 자재가KR 3Y · BOK rate · materials
ASSEMBLY STEPS
01
영향을 분석한다Analyze the impact
금리·자재가 변화가 조달 비용과 공정에 닿는 경로를 분석한다.Analyze how rate and material-price moves reach funding cost and schedule.
02
숨겨진 신호를 읽는다Read the hidden signals
수주·PF 데이터와의 시차에서 자금 조달 리스크 신호를 읽는다.Read the funding-risk signal in the lag against order and PF data.
03
정확한 예측을 돕는다Help forecast accurately
조달 비용 범위 · 사업 리스크 시점 · 자재가 민감도를 출력한다.Output funding-cost range, project-risk timing and material-price sensitivity.
KRATO / OPX구조를 설명하기 위한 개념 도면입니다. 치수는 도면 표기용이며 실제 장비 규격이 아닙니다.Concept drawings that explain the structure. Dimensions are drawing notation, not equipment specifications.UNIT · mm
FIG. 01 · EXPLODED VIEW도면 보기 ↑VIEW DRAWING ↑
01 / TREASURY · ACCOUNTING
재무 · 회계Treasury · accounting
기업의 재무·회계 조직. 환율·금리·유동성 변화를 자금·부채·외화 포지션 데이터와 연결해 조달 비용과 환 헤지 시점, 환산손익 범위를 예측합니다.Corporate treasury and accounting. FX, rates and liquidity linked to cash, debt and FX-position data to predict funding cost, hedge timing and FX translation range.
예측 결과물OUTCOME조달 비용 범위 · 환 헤지 시점 · 유동성 · 환산손익 범위Funding-cost range · hedge timing · liquidity · FX translation range
FIG. 02 · EXPLODED VIEW도면 보기 ↑VIEW DRAWING ↑
02 / MANUFACTURING · EXPORT
제조 · 수출Manufacturing · export
수입 원자재와 수출 비중이 큰 제조업. 환율·유가·금리의 변화를 원가·판매·재고 데이터와 연결해 다음 분기 원가 범위와 환 리스크 시점을 예측합니다.Manufacturers with imported inputs and export exposure. FX, oil and rates linked to cost, sales and inventory data to predict next-quarter cost range and FX risk timing.
예측 결과물OUTCOME원가 범위 · 환 리스크 시점 · 구매·재고 시점 민감도Cost range · FX risk timing · purchase and inventory sensitivity
FIG. 03 · EXPLODED VIEW도면 보기 ↑VIEW DRAWING ↑
03 / ENERGY · UTILITIES
에너지 · 유틸리티Energy · utilities
발전·가스·정유·데이터센터 전력. 유가·금리·물가 기대와 조달·운영 데이터를 함께 읽어 조달 비용과 투자 시점의 리스크를 예측합니다.Power, gas, refining, data-center energy. Oil, rates and inflation expectations read with procurement and operations data to predict cost and investment-timing risk.
예측 결과물OUTCOME조달 비용 범위 · 투자 시점 리스크 · 수요 변화Procurement cost range · investment-timing risk · demand shifts
FIG. 04 · EXPLODED VIEW도면 보기 ↑VIEW DRAWING ↑
04 / RETAIL · CONSUMER
유통 · 물류 · 소비재Retail · logistics · consumer
물가·소비 심리·환율의 변화를 판매·가격·재고 데이터와 연결해 수요와 가격 전가 여력, 재고 리스크를 예측합니다.Inflation, consumer sentiment and FX linked to sales, pricing and inventory data to predict demand, pricing power and inventory risk.
예측 결과물OUTCOME수요 범위 · 가격 전가 여력 · 재고 리스크Demand range · pricing power · inventory risk
FIG. 05 · EXPLODED VIEW도면 보기 ↑VIEW DRAWING ↑
05 / SEMICONDUCTOR · IT
반도체 · ITSemiconductors · IT
반도체 지수·메모리 가격·관세·수요 사이클을 주문·재고·캐파 데이터와 연결해 사이클 국면과 재고 리스크를 예측합니다.Semiconductor indices, memory pricing, tariffs and demand cycles linked to order, inventory and capacity data to predict cycle phase and inventory risk.
건설 · 부동산 · 인프라Construction · real estate · infrastructure
금리·자재 가격·자금 조달 여건을 수주·공정·PF 데이터와 연결해 조달 비용과 사업 리스크를 예측합니다.Rates, material prices and funding conditions linked to order, schedule and project-finance data to predict funding cost and project risk.
예측 결과물OUTCOME조달 비용 범위 · 사업 리스크 시점 · 자재가 민감도Funding cost range · project-risk timing · material-price sensitivity
적용 산업 예시입니다. 금융·경제를 읽는 엔진이기 때문에 금융 신호가 먼저 반영되는 산업이면 같은 방식으로 적용되며, 결과물 정의와 데이터 연결은 PoC에서 함께 정합니다.Example industries. Because the engine reads finance, it applies the same way to any industry where financial signals lead; outcome definitions and data connections are agreed in the PoC.
USE CASE 01 / MARKET RISK REVIEW
같은 반등. 리스크를 읽는 정보의 차이.The same bounce. A different set of facts behind the risk.
가격 반등을 확인한 다음, 거래량·브레드스·채널 상태까지 연결하면 리스크 판단은 어떻게 달라질까요?After you see the price bounce, how does the risk read change once volume, breadth and channel state are connected?
SHARED SITUATIONCPI가 컨센서스를 웃돈 뒤 10년물이 4.62%에서 버티고, NQ 선물은 초기 하락의 절반을 되돌렸습니다. 리스크 담당자는 60분 안에 익스포저를 유지할지 조정할지 점검해야 합니다.CPI came in above consensus, the 10-year is holding 4.62%, and NQ futures have recovered half of the initial drop. The risk owner has 60 minutes to decide whether exposure stays or changes.
EXAMPLE · STATE-ONLY REVIEW
가격을 확인하고, 판단 근거를 따로 모읍니다.Check the price, then collect the reasons separately.
알 수 있는 것WHAT YOU CAN SEE
현재 가격, 금리, VIX, 발생한 알림Current price, yields, VIX and the alerts that fired
추가로 확인할 것WHAT YOU STILL NEED
거래량이 평소 이 시간대 대비 충분한지, 상승 종목 비율이 따라오는지, 뉴스 해석이 한쪽으로 쏠렸는지Whether volume is normal for this time of day, whether breadth is joining, whether news interpretation leans one way
판단THE CALL
담당자가 지표 화면을 오가며 근거를 모아 리스크 수준을 정함The owner moves between screens, gathers reasons and sets the risk level
결과 확인AFTERWARDS
장 마감 뒤 결과를 돌아보고 원인을 설명Results reviewed after the close, causes explained in hindsight
“가격이 돌아선 건 알지만, 믿어도 되는 반등인지는 더 봐야 합니다.”“We can see the price turned. Whether to trust it is another question.”
THE RISK REVIEW KRATO CONNECTS
어긋난 신호와 그 경로를 같은 화면에서 봅니다.See the signals that disagree, and the path between them, on one screen.
알 수 있도록 설계하는 것DESIGNED TO SHOW
NQ ↔ 거래량 다이버전스 0.95, 지수 ↔ 브레드스 0.81, C2 채널 내부 다이버전스 0.92(알림 기준 0.35 초과)NQ ↔ volume divergence 0.95, index ↔ breadth 0.81, intra-channel divergence in C2 at 0.92 (above the 0.35 alert line)
함께 확인할 것SEEN TOGETHER
CPI → 10년물 → NQ로 이어진 관계 경로(0.90, 안정), 뉴스 채널의 해석 분열(C3 0.58), 리테일 심리와 옵션 스큐의 괴리(C4)The CPI → 10-year → NQ path (0.90, stable), split news interpretation (C3 0.58), retail sentiment versus options skew (C4)
판단THE CALL
60분 방향 하락 49% · 범위 ±0.71%. 참여 없는 반등이라는 읽기와 리스크 근거 경로가 리포트에 함께 남음60-minute direction down 49%, range ±0.71%. The “bounce without participation” read and its risk evidence path are recorded in the report
결과 확인AFTERWARDS
판단 시점의 예측과 실제 관측을 연결해 적중/미적중으로 기록The forecast at the time of the call is matched against what happened and logged as hit or miss
“거래량이 시간대 평균의 1.2배를 넘고 브레드스가 회복하면, 이 판단은 철회됩니다.”“If volume exceeds 1.2× the time-of-day average and breadth recovers, this call is withdrawn.”
INDICATORS AT THE SAME MOMENT · 대시보드와 같은 차트 소스 · 마우스를 올리면 값이 보입니다same chart source as the dashboard · hover to read valuesMARKETS · 5M · ET
RISK REVIEW / COMPARING RESPONSES
리스크 대응만큼 중요한 것은, 함께 확인해야 할 조건입니다.What matters as much as the response is the condition that comes with it.
대응 후보RESPONSE
기대하는 변화EXPECTED
함께 바뀌는 조건WHAT CHANGES WITH IT
판단에 필요한 근거EVIDENCE NEEDED
익스포저 유지Keep exposure
반등이 이어진다는 전제Assumes the bounce holds
거래량·브레드스가 뒤따르지 않으면 되돌림 위험Reversal risk if volume and breadth do not follow
시간대 대비 거래량, 상승 종목 비율, C2 내부 다이버전스Volume vs time-of-day, advancing share, intra-C2 divergence
조정 보류 · 관찰Hold and watch
확인 뒤 조정Adjust after confirmation
확인되는 동안 조정 비용이 달라짐The cost of adjusting moves while you wait
철회 조건(거래량 1.2×, 브레드스 회복)의 충족 여부Whether the withdrawal conditions (1.2× volume, breadth recovery) are met
헤지 보강Add hedges
하락 시 손실 완화Cushion a decline
반등이 진짜일 때의 비용, 옵션 스큐 변화Cost if the bounce is real, shift in options skew
10년물 4.60% 바닥 유지 여부, VIX 20 스트레스 구간 접근Whether the 10-year holds 4.60%, VIX approaching the 20 stress zone
검토 항목을 설명한 예시이며, 실제 추천이나 투자 조언이 아닙니다. KRATO는 예측과 리스크 근거를 제시하고, 결정은 사람이 합니다.An illustration of what is reviewed, not a recommendation or investment advice. KRATO presents forecasts and risk evidence; people decide.
TECHNOLOGY · WHAT MAKES KRATO DIFFERENT
리스크는 숫자 하나로 설명되지 않습니다.Risk is never explained by one number.
KRATO는 세 가지 기술을 따로 계산하지 않습니다. 하나의 알고리즘 안에서 동시에, 복합적으로 연산합니다. 이것이 KRATO의 기술 차별성입니다.KRATO does not compute these three separately. It runs them together, as one composite computation in a single algorithm. That is what sets KRATO apart.
01
다차원 · 다공간 시계열Multi-dimensional, multi-space time series
금리·환율·지수·거래량·뉴스·심리 같은 여러 변수(다차원)를 시장·국가·채널·기업 데이터라는 여러 공간(다공간)에 걸쳐 하나의 시간축으로 맞춰 읽습니다.Many variables — rates, FX, indices, volume, news, sentiment (multi-dimensional) — across markets, countries, channels and your own data (multi-space), aligned on one time axis.
무엇이, 언제 변했나What changed, and when02
채널별 다이버전스Per-channel divergence
각 채널 안에서, 그리고 채널 사이에서 함께 움직여야 할 신호가 얼마나 어긋나는지를 1·5·15·30·45·60분봉 단위로 쪼개 실시간 계산합니다. 기준선을 넘는 순간과 어긋난 신호 쌍을 기록합니다.How far signals that should move together pull apart, inside each channel and between channels, computed live at 1, 5, 15, 30, 45 and 60-minute resolution. The moment a threshold is crossed and the pair involved are recorded.
어디서 어긋나고 있나Where it is pulling apart03
과거 프랙탈 · 예측 결과 · 현상 비교Past fractals · forecast · observed reality
과거에 나타났던 프랙탈 구조(척도를 바꿔도 반복되는 패턴)와 현재의 예측 결과, 실제로 관측되는 현상을 나란히 비교해 지금이 어떤 국면인지 판단하고 예측을 보정합니다.Fractal structures seen before (patterns that repeat across scales) set against today's forecast and what is actually observed — to place the current phase and correct the forecast.
지금 어떤 국면이고, 예측을 얼마나 믿을 수 있나Which phase we are in, and how far to trust the forecast
01×02×03→
COMPOSITE ALGORITHM · OPX ENGINE · LPM세 가지를 하나의 연산으로 — 복합 연산 알고리즘Three in one computation — the composite algorithm시계열이 ‘언제’, 다이버전스가 ‘어디서’, 프랙탈 비교가 ‘어떤 국면인지’를 답하고, 세 답이 겹치는 지점이 리포트의 예측값·범위·리스크 근거가 됩니다.Time series answers ‘when’, divergence ‘where’, fractal comparison ‘which phase’. Where the three answers overlap becomes the forecast, range and risk evidence in the report.
USE CASE 02 / COMPANY DATA ON TOP
금융이 먼저 움직이면, 당신의 원가는 언제 따라올까요?When finance moves first, when does your cost follow?
수입 원자재 비중이 큰 제조 기업을 예로 든 시나리오입니다. 같은 엔진이 읽는 거시 지표에 기업의 원가·재고·판매 데이터를 더합니다.An example scenario for a manufacturer with a large imported-input share. The same engine's macro reads, plus the company's own cost, inventory and sales data.
ORDER · 고객의 요구CUSTOMER NEED다음 분기 원가가 어디까지 오를지, 환헤지와 원자재 선구매를 언제 해야 할지 판단하고 싶다.How far will next quarter’s cost rise, and when should we add FX hedges or buy materials early?
→
DELIVERABLE · 결과물RESULT원가 범위 · 환 리스크 시점 · 구매 시점 민감도Cost range · FX risk timing · purchase-timing sensitivity
PARTS · IMPORT & EXPORT MANUFACTURER
FXUSD/KRWUSD/KRW×1
WTI유가Oil×1
10Y미 10년물US 10-year×1
INF기대인플레Inflation exp.×1
C6원가 구성 · 재고 일수 · 결제 통화Cost mix · inventory days · settlement FX×1
1
REGISTER
원가 영향을 분석한다.Analyze the cost impact.
1-1USD/KRW · WTI · 미 10년물 · 기대인플레를 입력 채널로 등록한다.Register USD/KRW, WTI, US 10-year and inflation expectations as input channels.
1-2실시간 수집을 시작하고, 변수별 원가 민감도를 분석한다.Start live ingestion and analyze cost sensitivity to each variable.
2
INTEGRATE · C6
환 리스크 신호를 읽는다.Read the FX-risk signal.
2-1원가 구성 · 재고 일수 · 결제 통화를 C6 채널로 연동한다. C6는 격리 저장소에서만 연산한다.Integrate cost mix, inventory days and settlement FX as C6 — computed only in an isolated store.
2-2시장 변수가 우리 원가 구조로 전달되는 시차를 계산한다.Compute the lag before market moves pass into your cost structure.
2-3환 리스크가 커지기 시작하는 신호를 읽어낸다.Read the signal that FX risk is starting to build.
3
REPORT
헤지 · 구매 판단을 돕는다.Support hedging and purchasing calls.
3-1원가 범위 · 환 리스크 확대 시점 · 구매 시점 민감도를 리포트로 생성한다.Generate the cost range, FX-risk timing and purchase-timing sensitivity as a report.
3-2판단이 철회되는 조건을 함께 기록한다.Record the condition that withdraws the call.
환율·유가·금리의 변화가 다음 분기 원가로 이어지는 경로.The path from FX, oil and rates to next quarter's cost.
금융에서 읽는 것READ FROM FINANCE
USD/KRW의 방향과 범위, WTI의 20일 흐름, 10년물과 실질금리의 관계, 관세·물가 기대의 변화USD/KRW direction and range, the 20-day WTI path, the 10-year against real rates, shifts in tariffs and inflation expectations
기업 데이터에서 더하는 것 (C6)ADDED FROM YOUR DATA (C6)
월별 원가 구성, 원자재 재고 일수, 판매 단가와 수요, 결제 통화 비중 — 격리 저장소에서 결합Monthly cost mix, raw-material inventory days, unit price and demand, settlement-currency share — joined in the isolated store
예측하는 결과물THE OUTCOME PREDICTED
다음 분기 원가 범위, 환 리스크가 커지는 시점, 재고·구매 시점의 민감도 — 기업이 정한 결과물 기준으로Next-quarter cost range, when FX risk builds, sensitivity of inventory and purchase timing — in the outcome terms you define
리스크 관리RISK MANAGEMENT
기업 데이터와 금융 신호가 어긋나는 순간을 기준선과 함께 알리고, 판단 경로와 철회 조건을 리포트에 남김Flags the moment your data and financial signals disagree, against your thresholds, and records the evidence path and withdrawal condition
“금융이 먼저 반영한 변화를, 우리 숫자로 번역해 미리 봅니다.”“What finance has already priced in, translated into our own numbers, ahead of time.”
MACRO READS FROM THE SAME ENGINE · 대시보드와 같은 차트 소스same chart source as the dashboardMACRO · FX · ENERGY
예시 시나리오입니다. 기업 데이터(C6)는 PoC 단계에서 연결되며, 화면의 수치는 데모 데이터입니다.Example scenario. Company data (C6) is connected during the PoC; on-screen figures are demo data.
03 / FROM SIGNALS TO DECISIONS
금융을 읽고, 당신의 결과물을 예측합니다.Read finance, predict the outcome you need.
금리·거래량·해석·심리의 변화를 함께 읽고, 기업 데이터와 연결해 필요한 결과물과 리스크를 계산합니다.Reads rates, volume, interpretation and sentiment together, links them to your data and computes the outcome and the risk.
01INPUT
지금 어떤 일이 일어나고 있나?What is happening right now?
다섯 공개 채널과 기업 고유 데이터(C6)의 신호를 함께 살펴봅니다.Signals from five public channels and your own data (C6), side by side.
CPI 3.4%10Y 4.62%USD/KRWWTIBloomberg readRetail chatter기업 데이터Your data
금융 · 경제 · 뉴스 · SNS · 산업 + 기업 고유 데이터Finance · economy · news · social · industry + your own data
02ANALYSE
언제, 어디에서, 어느 척도에서 달라지나?When, where and at which scale does it change?
같은 데이터를 세 렌즈로 읽습니다 — 시계열(언제 변했나), 다이버전스(어디서 어긋나나), 프랙탈(척도를 바꿔도 반복되나).The same data through three lenses — time series (when it changed), divergence (where it disagrees), fractal (whether it repeats across scales).
01 시계열01 Time series02 다이버전스02 Divergence03 프랙탈03 Fractal불확실성Uncertainty
LPM다음 상태 예측Next-state prediction
03COMPUTE
어떤 관계가 지금 작동하나?Which relationships are driving this?
신호를 노드와 관계로 연결하고 강도·막힘·위기·순환을 4초마다 다시 계산합니다.Signals become nodes and links; strength, blockage, stress and loops are recomputed every four seconds.
CPI → 10Y → NQ 0.90NQ ↔ Volume 0.95C2 intra 0.92
OPX관계망 연산 · 경로 추적Network compute · path tracing
04OUTPUT
지금 상태는, 그리고 당신이 정한 결과물은?Where are we now, and what about your outcome?
현 상태 점검, 예측값과 범위, 리스크 알림, 판단 경로, 철회 조건을 리포트로 받습니다.A report with the state check, forecast and range, risk alerts, the evidence path and the withdrawal condition.
세 가지를 복합 연산해야, 예측이 됩니다.Compute the three together, and it becomes a forecast.
다차원·다공간 시계열은 무엇이 언제 변했는지, 채널별 다이버전스는 어디서 어긋나는지, 과거 프랙탈·예측·현상 비교는 지금이 어떤 국면이고 예측을 얼마나 믿을지를 봅니다. KRATO는 이 셋을 하나의 알고리즘에서 복합 연산합니다. 차트는 대시보드와 같은 소스입니다.Multi-dimensional, multi-space time series asks what changed and when, per-channel divergence where it pulls apart, and past fractal · forecast · reality comparison which phase we are in and how far to trust the forecast. KRATO computes the three together in one algorithm. Charts share the dashboard source.
01 / MULTI-DIMENSIONAL TIME SERIES
다차원 · 다공간 시계열Multi-dimensional, multi-space time series
금리·환율·지수·거래량 같은 여러 변수를 시장·국가·채널·기업 데이터라는 여러 공간에 걸쳐 같은 시간축으로 맞춥니다. 이벤트 전후와 시간대 기준 대비 변화를 함께 봅니다.Many variables — rates, FX, indices, volume — aligned on one time axis across markets, countries, channels and your own data, with change around events and against the time-of-day norm.
각 채널 안에서, 그리고 채널 사이에서 함께 움직여야 할 신호 쌍이 갈라지는 정도. 기준선 0.35를 넘는 순간과 어긋난 쌍을 기록합니다.How far pairs that should move together pull apart, inside each channel and between channels. The 0.35 crossing and the pair involved are recorded.
C2 채널 내부 다이버전스 · 최근 60분 · 라이브C2 intra-channel divergence · last 60 min · live
03 / FRACTAL · FORECAST · REALITY
과거 프랙탈 · 예측 · 현상 비교Past fractals · forecast · reality
같은 금리를 5분·일·정책 주기로 읽어 과거에 반복된 프랙탈 구조를 찾고, 현재 예측 결과와 실제 관측 현상을 나란히 비교해 국면을 판단하고 예측을 보정합니다.The same rate at 5-minute, daily and policy-cycle scales to find fractal structures seen before, set against today's forecast and observed reality to place the phase and correct the forecast.
10년물 5분 · 10년 BEI 일간 60일 · 연준 금리 FOMC 주기10Y 5-minute · 10Y breakeven daily 60d · Fed funds by FOMC cycle
EXAMPLE / BOUNCE WITHOUT PARTICIPATION
“가격이 돌아섰습니다”에서 “이 반등은 참여가 없습니다”까지.From “the price turned” to “this bounce has no participation.”
CPI 서프라이즈 뒤 10년물이 고점을 지키고, NQ의 되돌림은 참여 없이 진행됩니다.After the CPI surprise the 10-year holds its high and the NQ recovery proceeds without participation.
비교Compare
NQ ↔ 거래량, 지수 ↔ 브레드스, 뉴스 해석의 분열을 같은 관계망에서 봅니다.NQ versus volume, index versus breadth and the split in news reads, all on one network.
판단Decide
60분 방향 하락 49%, 리스크 근거와 철회 조건을 리포트로 기록하고 결과를 검증합니다.60-minute lean down 49%, logged with its risk evidence and withdrawal condition, then verified against the outcome.
KRATO가 연결하는 것은 예측값, 리스크 근거, 사람의 결정, 그리고 결과입니다.What KRATO connects is the forecast, the risk evidence, the human decision and the outcome.
04 / INSIDE A CHANNEL
어긋남은 채널 안에서 먼저 시작됩니다.Disagreement starts inside a channel.
시장 채널 하나만 봐도, 가격과 거래량은 이미 다른 말을 하고 있었습니다.Inside the market channel alone, price and volume were already telling different stories.
KRATO는 채널마다 수집 상태와 지연을 확인하고, 그 채널 안의 신호끼리 얼마나 어긋나는지를 계산합니다. 기준이 되는 60분 흐름 안에서도 움직임을 1 · 5 · 15 · 30 · 45 · 60분봉으로 쪼개 각 단위마다 따로 연산한 뒤 합칩니다. 짧은 봉은 순간적인 어긋남을, 긴 봉은 그 어긋남이 이어지는지를 잡아냅니다. 기준선 0.35를 넘는 순간과 어긋난 신호 쌍이 함께 기록됩니다.KRATO tracks ingestion and latency per channel and computes how far its own signals disagree. Inside the 60-minute baseline, movement is split into 1, 5, 15, 30, 45 and 60-minute bars, computed at each resolution and then combined: short bars catch a momentary split, long bars confirm whether it persists. The moment the 0.35 line is crossed is recorded with the pair that disagrees.
05 / CONTROL & TRUST
결정은 사람에게. 근거는 명확하게.People decide. The evidence stays clear.
기업의 기준과 데이터 경계를 제품 경험의 중심에 둡니다.Your thresholds and data boundaries sit at the centre of the product.
01 / THRESHOLDS
기업의 기준으로 확인Checked against your thresholds
다이버전스 알림 기준, 리스크 지수, 관심 채널을 기업별로 설정하고 판단에 반영하는 구조입니다.Divergence alert lines, risk indices and watched channels are set per institution and applied to every call.
02 / HUMAN JUDGMENT
예측은 제시, 결정은 사람Forecast proposed, decision human
KRATO는 주문을 직접 실행하지 않습니다. 예측값과 범위, 리스크 근거, 철회 조건을 제시하고 결정과 실행은 각 기관이 합니다.KRATO does not place orders itself. It presents the forecast and range, the risk evidence and the withdrawal condition; each institution decides and executes.
03 / ISOLATED DATA
기업 데이터는 격리된 채로Your data stays isolated
기업 고유 데이터(C6)는 격리 저장소에서 연산되고 다른 채널이나 다른 고객과 공유되지 않습니다. 알림과 리포트 이력은 추적할 수 있습니다.Institution data (C6) is computed in an isolated store and never shared with other channels or clients. Alert and report history remains traceable.
06 / OPERATIONS, CONNECTED
관계망 하나부터. 리스크 담당자의 하루까지.From one network to the risk owner's whole day.
일상 모니터링과 리스크 점검에 필요한 화면들을 같은 맥락 안에서 연결합니다.The screens used for daily monitoring and risk review, connected in one context.
07 / DEPLOYMENT
KRATO ASSEMBLY MANUAL데이터를 확인하고, 관측부터 시작합니다.Review the data. Start by observing.SHEET 03 / 03
ORDER · 고객의 요구CUSTOMER NEED우리 데이터로 실제로 맞는지 직접 확인한 뒤에 도입을 결정하고 싶다.We want to see it work on our own data before deciding to adopt.
→
DELIVERABLE · 결과물RESULT관측 리포트 · 검증 지표 · 다음 단계 범위Observe report · validation metrics · next-step scope
PARTS · POC · OBSERVE FIRST
C1–5공개 채널 커넥터Public channel connector×1
C6기업 데이터 커넥터Company data connector×1
GAUGE관측 게이지Observe gauge×1
EXT확장 모듈Extension module×N
1
CONNECT
데이터를 점검한다.Check the data.
1-1공개 채널(C1–C5)과 기업 데이터(C6)를 연동한다.Integrate public channels (C1–C5) and company data (C6).
1-2수집 주기 · 지연 · 누락을 점검한다.Check collection frequency, lag and gaps.
2
OBSERVE
예측을 관측한다.Observe the forecast.
2-1관측 모드로 실행한다. 어떤 결정도 자동 실행하지 않는다.Run in observe mode. Nothing is executed automatically.
2-2예측값(FCST)과 실측값(OBS)을 같은 기준으로 비교 · 기록한다.Log forecast (FCST) against observed (OBS) on the same basis.
3
EXPAND
검증된 만큼 넓힌다.Expand only as far as verified.
3-1방향 적중 · 범위 포함률 · 알림 선행 시간을 확인한다.Review direction hit rate, range coverage and alert lead time.
3-2검증된 범위만큼 시장 · 채널 · 알림 기준 · 리포트 주기를 확장한다.Extend markets, channels, alert thresholds and report cadence as far as verified.
OUTPUT SAMPLE · 완성 결과물FINISHED RESULT평가 항목 · 수치는 기업별 PoC에서 측정Evaluation items · values measured in each PoC
방향 적중Direction hit rate
PoC에서 측정Measured in the PoC
범위 포함률Range coverage
실측이 예측 범위 안에 든 비율Share of outcomes inside the range
알림 선행 시간Alert lead time
어긋남을 얼마나 먼저 알렸는가How early divergence was flagged
다음 단계 범위Next-step scope
검증된 시장 · 채널 · 결과물Verified markets · channels · outcomes
기존 데이터 위에. 기업에 맞는 예측과 리스크 관리.On the data you already have. Prediction and risk management shaped to you.
데이터를 확인하고, 관측부터 시작해, 검증 가능한 범위부터 넓힙니다.Review the data, start by observing, expand only what has been verified.
01 / CONNECT
데이터와 조건 확인Data and conditions
보시는 시장, 기업이 보유한 데이터, 접근 권한과 보안 요구사항, 예측하려는 결과물을 함께 검토합니다.We review the markets you watch, the data you hold, access and security requirements, and the outcome you want predicted.
02 / OBSERVE
관측 모드로 시작Start in observe mode
공개 채널과 기업 데이터를 연결하고 리포트의 예측값·범위를 실제 결과와 비교해 예측 품질을 평가합니다. 기간과 평가 기준은 기업별로 합의합니다.Connect the public channels and your database, then compare report direction and range against outcomes to evaluate forecast quality. Period and criteria are agreed per company.
03 / EXPAND & VERIFY
적용 범위 확대Expand the scope
검증 결과에 따라 시장, 채널, 알림 기준, 리포트 주기를 단계적으로 넓힙니다.Markets, channels, alert thresholds and report cadence are widened step by step according to what has been verified.
온프레미스 · 프라이빗 환경 · 기업 데이터 격리 연동On-premises · private environment · isolated integration of your database배포 구성과 제공 기능은 PoC 범위에 따라 협의합니다.Deployment and features are agreed within the PoC scope.
08 / FREQUENT QUESTIONS
도입 전, 궁금한 것들.Before you start, common questions.
KRATO는 어떤 제품인가요?What is KRATO?
금융·경제·뉴스·SNS·산업을 읽는 엔진에 기업 고유 데이터를 더해, 기업이 필요로 하는 결과를 예측하고 리스크를 관리하는 프로그램입니다. OPX는 엔진, LPM은 핵심 기술입니다.A program that adds your own data to an engine that reads market, macro, news, social and industry signals, predicts the outcome you need and manages the risk. OPX is the engine, LPM the core technology.
금융회사가 아닌 기업도 쓸 수 있나요?Can a company outside finance use it?
네. 금융 시장은 경제 전반의 변화를 가장 먼저 반영하기 때문에, 금융을 읽는 엔진은 산업 전반의 예측에 유리합니다. 환율·금리·원자재·수요의 변화가 기업의 원가·판매·재고에 어떻게 이어지는지를 기업 데이터와 함께 예측합니다.Yes. Financial markets reflect change across the economy first, so an engine that reads finance has an advantage across industries. It predicts how shifts in FX, rates, commodities and demand carry into your cost, sales and inventory, together with your data.
투자 기관도 활용할 수 있나요?Can investment institutions use it?
네. 금융·경제를 읽도록 만들어진 엔진이라 시장 상태, 신호 사이의 관계, 다이버전스를 근거와 함께 제시합니다. 자산운용·증권·연기금 같은 투자 기관은 포트폴리오 리스크 점검, 이벤트 전후 점검, 판단 근거 기록에 활용할 수 있습니다. 제공되는 정보는 투자 조언이 아닙니다.Because the engine is built to read finance and the economy, it presents market state, the relationships between signals and divergence with evidence. Investment institutions can use it for portfolio risk review, event checks and recording the evidence behind decisions. It is not investment advice.
우리 회사의 데이터도 연결할 수 있나요?Can we connect our own data?
네. 기업 고유 데이터는 여섯 번째 채널(C6)로 연결되며 격리된 저장소에서 연산됩니다. 다른 채널이나 다른 고객과 공유하지 않습니다. 연결 범위와 방식은 도입 단계에서 함께 정합니다.Yes. Your data joins as the sixth channel (C6) and is computed in an isolated store, never shared with other channels or clients. Scope and method are agreed during onboarding.
화면의 수치와 예측은 실제 성과인가요?Are the on-screen figures and forecasts real results?
실제 제품 화면이지만 데이터는 데모 시나리오입니다. 수치와 문장은 설명용 예시이며, 예측 성능은 기업의 데이터로 관측 모드에서 별도 검증합니다.The screens are the real product, the data is a demo scenario. Figures and sentences are illustrative; forecast quality is verified separately in observe mode on your data.
어떤 시장을 다루나요?Which markets are covered?
현재 데모는 미국과 한국 시장을 다루고, KR 08:00 KST · US 08:30 ET 개장 전 리포트를 냅니다. 다른 시장과 리포트 주기는 PoC에서 논의합니다.The current demo covers the US and Korean markets with pre-market reports at 08:00 KST and 08:30 ET. Other markets and cadences are discussed in the PoC.
도입 비용은 어떻게 결정되나요?How is pricing decided?
대상 시장, 연결 데이터, 리포트 범위, 지원 조건에 따라 협의합니다. 먼저 PoC의 목표와 평가 기준을 함께 정의합니다.Agreed according to markets, connected data, report scope and support. We start by defining the PoC goals and evaluation criteria together.
GLOSSARY
다이버전스Divergence
함께 움직여야 할 신호 쌍이 갈라지는 정도. 0~1, 알림 기준 0.35.How far a pair that should move together pulls apart. 0–1, alert at 0.35.
시계열Time series
이벤트 전후와 시간대 기준 대비의 변화. 60분 기준 구간을 1·5·15·30·45·60분봉으로 쪼개 각 단위에서 변화가 시작된 시점을 찾습니다.Change around events and against the time-of-day norm; the 60-minute baseline is split into 1, 5, 15, 30, 45 and 60-minute bars to locate when change began at each resolution.
프랙탈Fractal
5분·일·정책 주기처럼 척도를 바꿔도 반복되는 구조. 현재 국면과 다음 상태 확률을 계산하는 데 씁니다.Structure that repeats across 5-minute, daily and policy-cycle scales; used to place the current phase and the odds of the next state.
레짐Regime
관계망 전체의 상태 — Constructive · Neutral · Stress. 긍정/부정 노드 비율과 위기 관계 수로 계산.State of the whole network — Constructive, Neutral, Stress — from the bull/bear share and crisis links.
철회 조건Withdrawal condition
리포트의 판단이 취소되는 조건. 예: 거래량 1.2× 이상, 브레드스 회복.The condition that cancels a report's call, e.g. volume above 1.2×, breadth recovers.
C6
기업 고유 데이터 채널. 격리 저장소에서 금융 관계망과 함께 연산되며 다른 고객과 공유되지 않습니다.The company's own data channel, computed with the financial network in an isolated store and never shared.
READ FINANCE. PREDICT YOUR OUTCOME.
금융을 읽는 엔진 위에, 당신의 데이터를 올리세요.Put your data on an engine that reads finance.